Data Structures 101: Introduction To Graphs
A simple introduction to Graph data structure.
✨ Introduction
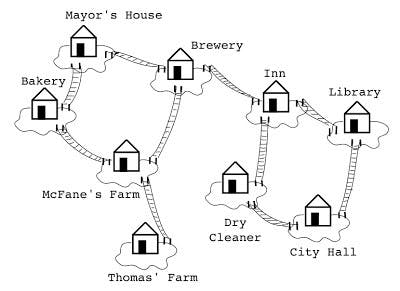
A graph is a data structure composed of a collection of nodes and edges. The nodes are interconnected with each other with edges. Graphs are a non-linear data structure.
Nodes are also called vertices. A vertex/node can also have weight which is called the cost.
✨ Types Of Graphs
There are a lot of types of Graphs. For the sake of this article, we will cover Directed and Undirected graphs. If you are interested in learning about other types you can read this post: Types of Graph Data Structure
Directed Graph
A graph whose pairs are ordered is called a directed graph, or just a digraph. When pairs are ordered in a directed graph, an arrow is drawn from one pair to another pair.
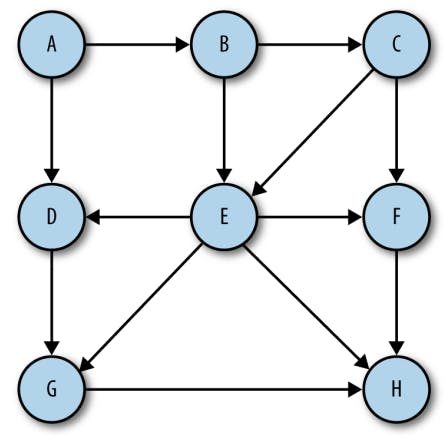
Directed graphs show the flow direction from one vertex to another vertex. You can see that vertex A has two directions, from A to B and D. This is an example of a Directed Graph.
Undirected Graph
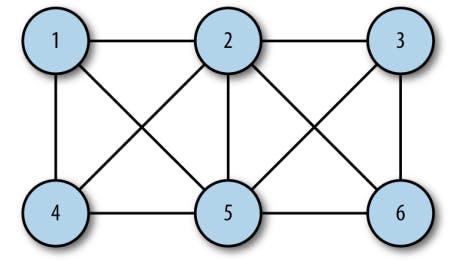
If a graph is not ordered, it is called an Undirected/Unordered graph, or just a graph. It's the simplest form of a graph where all the vertices are connected but not in a flow or direction.
✨ Applications of Graph
Graphs are one of the most used data structures in big-scale applications. You will find it everywhere! Let's take a look at some of the big applications of graphs
Social Platforms
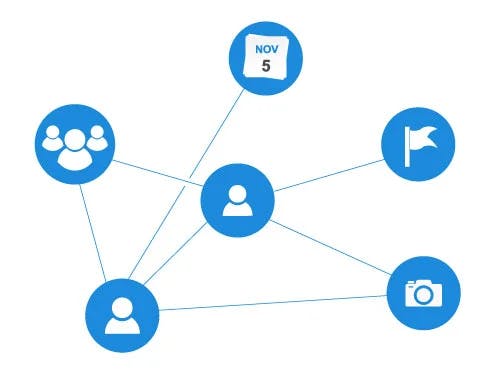
Graphs are highly used to structure social data. Social graphs draw edges between you and the people, places, and things you interact with online. Entities are like Users, Pages, Places, Groups, Comments, and a lot more. All of these are like Vertices, representing single-user data.
Networks
Computer networks, including local area networks and much broader networks such as the Internet, are also frequently modeled with graphs. Graphs also help in the routing of signals such as calculating the shortest path for the signal to transfer.
Recommendations
Graphs are highly used in recommendation algorithms. GLRS (Graph Learning-Based Recommender) systems are totally built over graphs where the important objects such as users, products, items, etc are connected.

The graph helps us to calculate the recommendations in real-time when users are interacting with other components of the systems. This gives the customer the feel of talking to a sales assistant in-store and makes her experience more personalized.
Path Optimizations
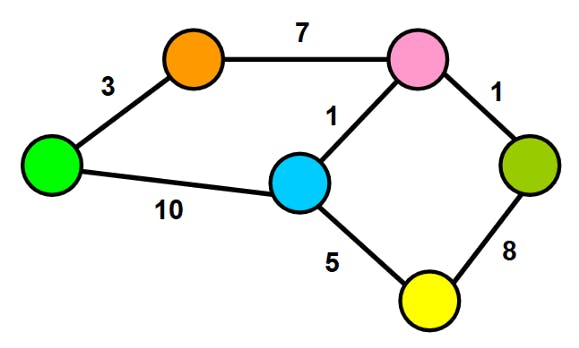
Graphs also help us to optimize the path from one point to another point. There are so many algorithm implementations in Graph that are used in real-world systems to find the shortest path between source and destination.
Databases
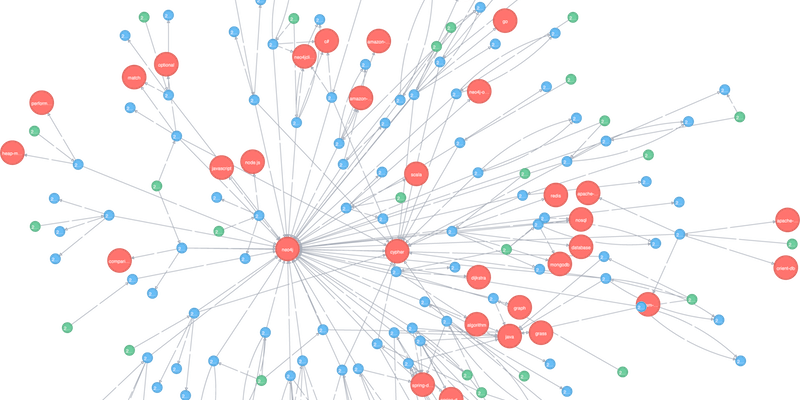
The graph data structure is also used in Databases. Neo4j is a database that provides a graph-based database. This database is highly used in data- centric applications.
Graph Representation
1. Adjacency Matrix
Graphs can be represented using the Adjacency matrix. Adjacency Matrix is a 2D array of size V x V where V is the number of vertices in a graph.
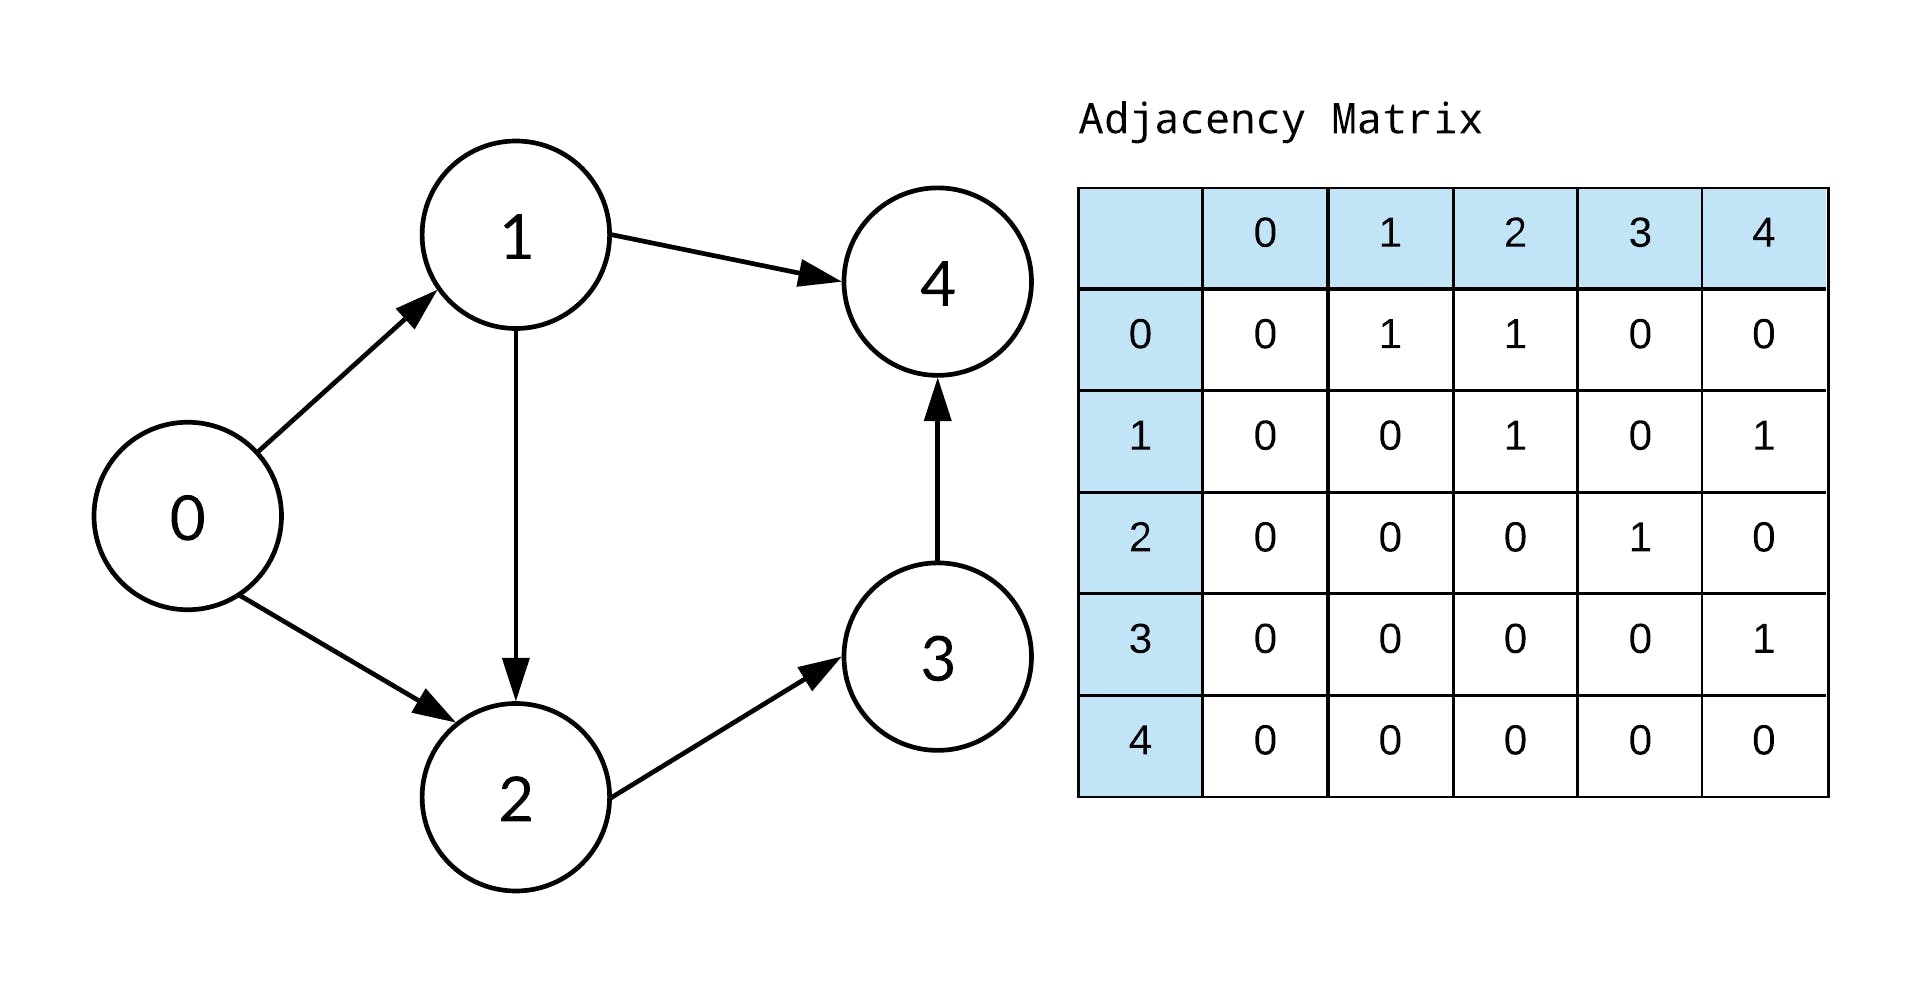
The adjacency matrix for the undirected graph is always symmetric.
2. Adjacency List
In this approach, we use an array as a list. The size of the array is equal to the number of vertices.
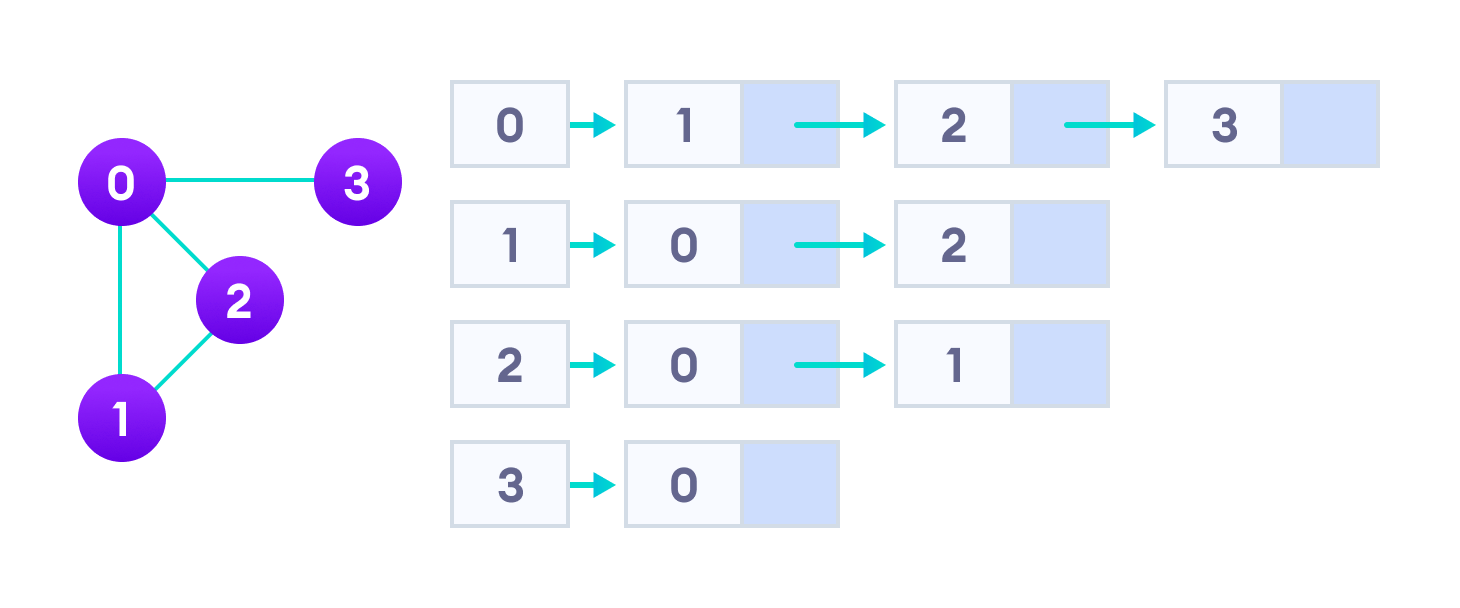
Every element is a vertex that is combined with its connection. For example, the 0 vertex is connected to 1, 2, and 3.
So we will represent it like this:
graph = [
  [0, 1],
  [0, 2],
  [0, 3],
  [1, 0],
  [1, 2],
  [2, 0],
  [2, 1],
  [3, 0]
];
Also, we can create the adjacency list in the following structure as well:
graph = {
 0: [1, 2, 3],
 1: [0, 2],
 2: [0, 1],
 3: [0]
}
We can create a hash map and all the nodes become the keys of hashmap and the value of every key is an array of all the connected nodes to that vertex.
✨ Time Complexity
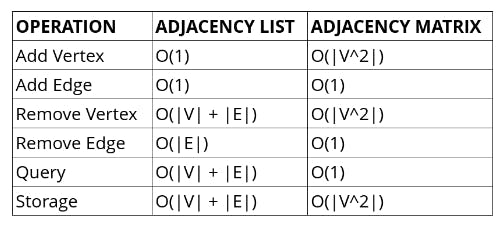 Where:
- |V|: Number of vertices
- |E|: Number of Edges
In the next part, we will learn how to implement the graphs using adjacency lists.
Stay tuned!
That's it, folks! hope it was a good read for you. Thank you! ✨

